Weather stations and data loggers

Hi

I am seeking to set up weather stations that enable separating the sensors by the distance required to give good accuracy. Many weather stations do not enable you to do this. I would like to set up a few of them in my region to collect weather data to provide a (non for profit) service to help get more weather stations in the area to help communities.

It would be good to have the temperature and humidity sensor at about 1.5 meters above the ground in an instrument shelter. However, I would like a grass temperature sensor that could be mounted about 2 meters away from the shelter. A rain gauge is best about 2 meters away from the shelter as well and its position would need to vary depending on the station location. If it is an exposed area without wind breaks, the gauge may be best near the ground. However, if there are trees that could block the rain, the gauge may be better about 2 meters above the ground. The anemometer and wind vane would need to be on a mast about 10 meters high. These may not be needed in some areas that are not exposed to the wind and not having them could save costs. A barometer sensor could be in the weatherproof box containing the data logger.

Does anyone know of any accurate weather stations that enable this and what they would cost?

Another option is to just buy a data logger and connect weather sensors that I choose. I am wondering if that could also work out to be more cost effective.

My current system does this already. However, I am wondering if there is something already made up that could be both accurate and more cost effective.

Currently I have a system that samples voltages between 0 and 5 volts on 10 input ports and I have software that lists each voltage sample in a table in a text file containing 10 columns that can be opened in Microsoft Excel and pasted into a file with formulas to calculate the values for temperature, rainfall, light, wind direction and wind speed. The file also generates graphs of the information which are linked below. Currently, my software records the voltage from each input every half a second so that each hour there are about 7200 lines of data in the file. My current system can therefore sample data from 10 different weather sensors. However, it uses old technology so if I use a similar system I would need a logger with several ports to connect to the USB port of a computer.

If I use this method, I am wondering if you know of a suitable low cost logger that connects to USB and if there are computer programs already made that enable sampling the data like I am currently doing as explained above, and if so, what could they cost? Would it be easy to find or write a program to do this and do you know who could do it for me? I assume these would all work on Windows 7 and above.

It would be good to get a logger that will wirelessly connect to a USB port of a computer about 100 meters away. If they are much more expensive than a system that has to connect to the computer by a USB cable, it could be better to have the computer also in a box outside near the weather station and then wirelessly connect to a router.

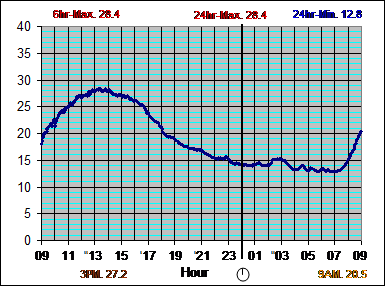
I prefer software to graph out the measurements and keep a record of the graphs indefinitely in an archive. Only one weather measurement per graph is better. Some software programs graph out different measurements like wind speed and temperature on the one graph and it is confusing. However, temperature and dew point temperature could occur on the one graph and average wind speed and maximum wind gusts are good on the one graph. I prefer a graph with darker grid lines for every 5 degrees Celsius and lighter lines for every 1 degree. Many do not contain the lighter lines and it makes it harder to get an accurate reading. Please see an example of my existing charts at graphs . Graphs could be joined. However, the reset times for the measurement need to start at 9AM for most records like rainfall and temperature. Graphs in many software programs go from midnight to midnight which is not good because the rainfall totals and temperature records do not match the BoM records. Graphs are best labeled with either maximum/minimum measurements or the accumulated rainfall for the 24 hour recording period starting from 9AM. It would be good to offset and calibrate the readings in the software so the sensor readings match the readings of very accurate instruments. To do this, accurate instruments like the BoM use could be placed beside the sensors and the software calibrated to the readings of the accurate instruments. I am wondering if there is any software that enables what I describe above? My graphs are generated from Microsoft Excel. But, it can be time consuming to manage and also correct and delete false or missed readings. A table or graph of daily totals over the months would also be of great benefit.

Regards Richard.

2 Likes

Hey @Richard276543, welcome to the forums!

You really seem to have your requirements nailed for this project. What sort of data logger are you using at the moment to record your input?

100m of distance is a fair distance for common wireless protocols to cover properly (wifi, Bluetooth, etc). The most reliable way to do this would be to have some kind of receiver on the computer end to pick up this signal. The LoRa communication protocol comes to mind as a good option for this but you would need a receiver on your USB port to pick up this signal.

When you say your software would need to work on Windows 7 and above, are you currently using Windows 7 for this project or would recommendations suitable for Windows 10 and 11 be appropriate?

Most of the weather stations I could find have all the sensors fairly close to each other. I think that using a data logger with individual sensors that you can individually reposition sounds like the best option at the moment given how you need to position your sensors.

The ppLOGGER project comes to mind as a good alternative to a standard datalogger although this is moving more into the DIY space and would require a fair bit of setup.

Hope this helps!
Sam

2 Likes

Hi Richard

That is a lot of data.
Is there any practical reason for sampling so often? For instance you only graph the rainfall rate at mm/hr so surely once per hour would satisfy this graph.

Storage medium usually has a finite capacity as do most loggers which will dictate how many storage devices you will need. Reducing your sampling rate willl help here.

As Samuel just said that is another problem.
Cheers Bob

3 Likes

Hi

Currently I am using an old logger named K2805 that was made up for me from a kit from Dick Smith Electronics years ago that uses a parallel port interface. This is old technology so I thought a system on a USB port would be better.

A lot of samples are needed because wind gusts are often very short and if the sample rate was longer the maximum speed could be missed.

What I do is a data summary to condense the file so that only the maximum or median values of the samples over the last 36 seconds are pasted into another file. This reduces the number of samples pasted into the main file with the graphs.

Anemometers output a frequency that is converted to a voltage via another circuit for my current system. However, I wonder if the software could also easily make the logger sample the frequency directly without having to do this.

The main thing is to first work out the type of logger I could use. People have suggested the Arduino Mega2560 or D1 Minis ESP8266 or Raspberry Pi Pico or Arduino Nano RP2040. I thought something with at least 10 analogue inputs would be better as I am not sure about digital sensors and what output they could produce. I also wonder if digital sensors could have an advantage and I could still go that way if there is an advantage. Currently I have been using analogue LM335Z temperature sensors. I may also invent other sensors and have already made a sensor out of a light dependent resister to record the light intensity.

Another thing I am thinking of adding would be the output from a load cell sensor. This could be used to make a weighing rain gauge as you can see at weighing rain gauge - Google Search . They are very expensive to buy but much more accurate than a tipping bucket version. However, I think I could make them for a much lower cost with an accurate load cell. I just need some help to get a circuit made for the load cell so the output could easily connect to the logger. On my current system it would need to generate between 0 and 5 volts. A 1 or 2kg load cell could be used.

It may be best to choose a logger that is easy to program to do what I need if there is not a program made already. Also, I need one that could transmit wirelessly between the logger and the computer.

Someone suggested a program solution could be explained at https://www.instructables.com/Sending-data-from-Arduino-to-Excel-and-plotting-it/ but I am not sure if that could do what I want as I do not know about programming.

The operating system may not matter for the computers that sample the data so Windows 10 could be good. Some people suggest Linux is better.

The central computer that processes the data to generate the graphs could be best to use Windows XP if I cannot find a solution to a strange problem where later versions of Windows changes the text on the graphs to make it look terrible when the graphs are saved to a PNG format. I have been using Microsoft Excel 2003 and prefer not to change as I find it difficult to get used to different layouts.

Do you know what logger or method would be best for me?

Regards Richard.

Maybe not of help to @Richard276543 but I have been developing a Weather Station and have used RS485 to communicate between the data logger and the sensors. Connection is via cat5 cable.

The data rate is 9600 baud, giving a theoretical cable length of 10 kilometers according to the RS485 specification. In my case it is just wiring inside my house, garage to roof.

The Wind Speed and Direction sensors get read every 5 secs, the other sensors every minute. Probably could reduce this every 5 minutes as they dont change very often.

Anyway, just my 2 cents …
Regards
Jim

1 Like

Have a look at the Core Electronics PiicoDev sensor range, all are I2C digital communications, very easy to implement using a Pi or Pico and Python.

Also have a look at the Wind Speed and Wind Direction devices Core stock, I am using them for my project. They have an RS485 interface and produce a m/sec and degrees output, all calculation is done inside the unit. Very happy with how these devices are currently working.

Cheers
Jim

2 Likes

Hi Richard

I don’t know if that is such a good idea.
All Windows OSs including and before Windows 7 have not been supported by Microsoft for some time now. You could find yourself in a situation where your results, although look good to you, are no use to anyone else because the software to generate them is to old and the modern version may not handle it as expected. I think backward compatibility for Windows applications is pretty good I don’t know how far that goes. You have already found one little problem with text on your graphics.
Cheers Bob

2 Likes

Hi

Thanks for the info. Jim, could you send me a link to the logger system you are using and also any good wind speed and direction sensors you like? Also, I would like a link to the graphs your weather station generates if possible. You say “all calculation is done inside the unit”. Can the calculations be adjusted or offset if they are different to readings from accurate instruments the BOM use? It is good to test the accuracy of your sensors against accurate instruments that are placed beside them. You can then adjust the readings in the software to them if possible.

The graphs I saved on a Windows XP machine a few years ago still look good in my modern browser and Windows 10. All the Windows XP machine would do is generate the PNG images that are uploaded to a server. You can see the graphs at graphs . The only problem is that Windows XP is normally installed on old machines that could break down. So it would be good if we could find a way to get Microsoft Excel 2003 to generate the PNG images without degrading the fonts when later versions of Windows are used. You can see an example of how it degrades at http://weather.org.au/tolga/template-9AM-15-6-24w_files/image001.png . It would be appreciated if you can download the XLS file and save it as a web page to generate the PNG images and you can see if the fonts are changed. Let me know if you find a way to fix it. It is at http://weather.org.au/tolga/template-9AM-4-8-24.xls

Regards Richard.

The data logger is my own design and a work in progress. Raspberry Pi 3B+ running a Python program I have written. The data is organised as Python dictionary entries and saved as text. The program serves a web page using the dictionary entries as the displayed data.

Sensors are recorded every 5 minutes, each new day starts a new file, size is about 50k per day, plenty of room on the Pi to store years of data. I know it won’t be capturing all data for fast changing sensors like Wind Direction and Speed but I may change this in the future.

Getting the web page to display graphs is the next part of the project. I have an example and will improve on that when I have a better understanding of HTML & Java.

The accuracy of the sensors is not of great concern to me, developing the project, getting the hardware and software to work is to keep my old brain active. Many digital sensors can be adjusted for accuracy if a reliable accurate instrument is available.

Comparing my sensor readings with the BoM data depends on the type of sensor and where BoM is measuring. Barometric pressure should be the same and my program adjusts for the height above sea level of my location and matches the BoM. Temperature and Humidity are very localised and can be affected by many conditions. The BoM recording station is a few suburbs away from where I live. I think the Air Quality sensor is affected by long term less than 0 celsius temperatures.

The devices below are what I am using for Wind Speed and Direction, the direction device has a mark you align with north using a compass. Also is a link to a rain gauge I will test when I buy it.

My stepdaughter bought an all in one plastic weather station, it didn’t last long. I want mine to last years.

Cheers
Jim

2 Likes

Hi Richard

Interestingly it seems the font degradation/modification is only for horizontal text The vertical numbers seem unchanged.

I suppose that age catches up with everything. I have an XP laptop that has to be 25 years old and still OK (the battery is long defunct but has to be in situ I think for the laptop to work).
I really only keep it because it still runs one of the best music management apps that I have ever seen. MusicMatchJukebox. So popular that I believe there are still people trying to make it work on modern machines.

Getting back to your font problem, does Excell 2003 allow you to change the fonts used in the graphs. You may be able to find an acceptable font that is compatible with later versions of Windows. I personally don’t know as I don’t use any version of Microsoft Office, I prefer another one.
The other alternative could be to use a later version of Excel with a later version of Windows.
Cheers Bob

1 Like

This could possibly be ClearType implemented on a display with an incompatible configuration.

However I think it is more likely that Excel has been set up with special formatting for some of the text elements of the graph - something like shadowed or engraved - and it hasn’t worked properly at small font sizes.

1 Like

Hi

Thanks for the info. Jim, how many analogue inputs does the Raspberry Pi 3B+ have and can your program read the voltages on each of them? My current program allows the sample interval to be adjusted. Can you do that?

Also, your anemometer would miss out on recording the most interesting wind speeds if they occur above 32.4m/s.

Does anyone know if https://pi-plates.com/pplogger-an-open-source-multi-channel-data-logger-for-the-raspberry-pi/ or https://www.instructables.com/Sending-data-from-Arduino-to-Excel-and-plotting-it/ could do what I need?

Regards Richard.

2 Likes

The Raspberry Pi has NO analog inputs. All the sensors are digital.
There is a Pi Pico microcontroller located with the sensors. It reads the sensor data via an I2C interface and sends it to the Pi 3B+ via a RS485 interface board.

The Wind Speed and Direction devices send data via their own RS485 interface. The limitation on wind speed is acceptable to me. If this was more than a hobbyist setup I would do it very differently and with different devices.
I would still go with digital devices. There are benefits to turning analog signals into digital as close to the sensing element as possible.

The sampling interval can easily be changed in the program. 5 minutes was chosen due to some conditions not changing very fast and to reduce the amount of data collected. As time goes on this may change.

The only limit on the sampling interval is the response time of each sensor.
Example: The TMP117 Precision Temperature Sensor take around 400uS to provide the reading.

Regards
Jim

1 Like

Hi

What advantages would digital sensors have over analogue ones and could they work for my purpose?

Could digital sensors connect to a logger so the output can be made to generate a text file containing voltages or frequencies like I described in my initial post?

Regards Richard.

The analog output of a sensor will have to be converted to digital form at some stage before it is recorded into a text file. This can happen at any stage of the path from sensor to text. However, digital signals are easier to transmit over long connection paths (including wireless connections), are easier to merge into a single transmission method, and are easier to record to media. As a result it is usually considered preferable to convert the sensor readings to digital form as closely as possible to the measurement point.

1 Like

Hi

Perhaps a logger with both digital and analogue inputs could be good. Is it hard to program a logger to get the values of the sensors logged and do you know if it would be easier for digital sensors? Do you have an idea of how many hours work it could take as I may need someone to do it for me? Alternatively, there may be something done already that I could use.

I thought the logger would have to be close to the sensors anyway and the sensors wired to it with up to 15 meters of cable. The wireless connection would be good between the logger and the computer that could be 100 meters away. So, if this is the case, I wonder if digital sensors would be any advantage?

Regards Richard.

1 Like

A search for professional data loggers reveals a wide range of prices. The companies that develop these devices spend many hours and a heap of money to develop a high quality reliable product, the price is an indication of how much may have gone into its development.

*eg. The HOBO U12 Stainless 5-inch Probe Temperature Data Logger is ideal for monitoring internal temperature of foods or any application where fast response is critical. *
$1,092.00 ex GST $1,201.20 inc GST

A single once off development at a professional level is not viable, anything will be a compromise.

Given the paths I have taken and abandoned; the many hours I have spent on the project. My cost would be well over $10,000 for my time and parts over $1500. As I stated before I am doing this to keep my old brain active not for payment.

I have designed and built stuff for friends in the past and the money has not been worth it and the product does not have the quality I want for someone with a non technical background using it.

You will find pretty much every weather sensor today produces a digital output. Once it is digital, and the microcontroller has an internet connection, the data can be sent and stored anywhere in the world.

Cheers
Jim

1 Like

Hi

There may be a better solution that is very low cost with a Esp32 board. I am discussing this on the forum at Logging voltages for weather sensors - #33 by davidefa - Project Guidance - Arduino Forum . I would like you to have a read of the last few posts and let me know what you think.

Regards Richard.

I agree with all the posts you have received on the other forum. Everyone has been giving you good advice. There is no perfect solution, there is no right solution to do anything. It all depends on what you want and how well you understand how to do it.

But, you don’t need to understand the electronics or the software, you need to be able to clearly state what you want to see on a screen or on instruments or something else. State what you want to measure, etc. If you want a particular type of interface or processor or equipment then this must be stated, but adhering to rigidly to this can compromise your design.

Someone with the knowledge and skill can design and build it for you. If you have clearly defined design parameters it can be easily priced. To me you are in the information gathering stage, finding what is available and its capability and price.

In the other forum you say:
I cannot see how digital sensor outputs could work to give values that slowly change (like temperature) if the values are either only a 1 or 0.
Well a simple digital interface will not. But …
Inside the TMP117 sensor the analog temperature is converted to a 16 bit digital word and it is sent via the I2C interface. This gives a resolution of 0.003 degrees celsius. (temp range -55 to 150 degrees celsius) This is better than an analog voltage sensor would give.

The I2C transfer rate takes about 1ms per measurement. You have a very accurate sensor capable of sending its measurements very fast

So when someone says digital sensor they are referring to something like that above.

Anyway, I read the other post and you are asking the same questions and getting the same answers.

Cheers
Jim

4 Likes