I have just shared a new project: “Roverling Mk.ⅠⅠ”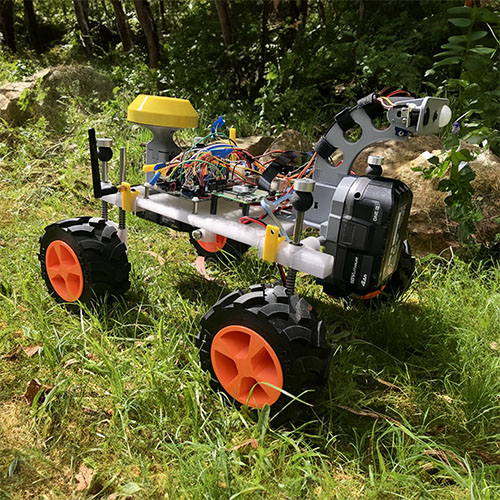
IntroductionA few months back I created a basic mobile platform using parts from an old 3D printer. It was fun but not very practical.
I designed Roverling Mark II so I could experiment with a practical, configurable, and reliable mobile plat…
Read more
2 Likes
Roverling MKII is now been integrated with a newly designed Pulse Induction Metal Detector. So far 3 months and It is still a work in progress but is working a lot better than I expected.
The aim is to detect and accurately map a wide area for ferrous and non-ferrous metals for later investigation and digging. And maybe riches.
I’m just starting the integration part of the design now, and will publish all details when it is complete.

If you want to follow progress I post regular updates and details on Instagram. #Roveling or @markmakies will get you there.
5 Likes
Hi Mark,
As a mechatronics enthusiast I am always keen to see projects with more of a robotics swing. I look forward to seeing how you progress.
Hi Everybody,
I’m looking for some ideas to solve a particular problem. I have a robotic platform towing a metal detector at a speed of about 0.5 m/s. It is able to identify between ferrous and non-ferrous metals. It will travel over a predefined area autonomously, just like a smart mower, but smarter, and using well defined search pattern, straight lines and slight overlap .
My first thoughts was to just let it do its thing for a few hours and then look at the data, on the desktop - basically a heat map of the area with a Z axis representing the value received from the detector. Positive for ferrous (retards response pulse) and negative for non-ferrous (advances response curve). The magnitude, Y axis below, representing size of object proportionally and inversely proportional to the depth squared (or maybe cubed - not sure). The value shown on the chart is a 32 bit value representing the delta from the baseline. Not that it is important, but the baseline voltage is about 4V, represented by 0 on the chart and the vertical resolution is 4.6mV/div.

On this chart the X axis represents time as the detector travels along (slowly). Going from left to right, in seconds, approximately:
10s : no metal samples
5s: passing over a silver serving spoon, depth 150mm
5s: nothing
5s a piece of galvanized pipe, 10cm long
5s nothing
5s copper pipe, 20cm long
5s nothing of interest
However I want a simpler system. At the moment I need to go back over the data, on the desktop after downloading, identify locations of interest, then back into the field, find the location, probably refine location, and then dig.
What I would really like is some automatic marking. Maybe a couple of marking spray cans that would give a short green or red spray on the ground at that location. Maybe drop something or stick a small flag/marker on/into the ground. This would mean no desktop or telemetry required, making it much easier to use anywhere.
Looking for any ideas.
Thanks,
Mark
For background info, all my design notes are available on my blog.
2 Likes
Hi Mark.
It’s been fun following this build. ![]()
What about water and food colouring?
Is there any reason you couldn’t use a water pump to push colored water out the base of the bot?
On detection, the pump turns on, and pushes red water through a spray or even just little drip on the ground.
Just a thought; cheap and simple?
Pix ![]()
1 Like
Thanks Pix,
Good idea and simple. It also solves another problem: I don’t want to put anything electrical or metal near the sensor coils, but the bot is about 50cm further forward, so if marking from the bot I would need to know what direction it was heading at that time to determine the exact spot where something was detected.
However the sensor coil doesn’t see a small plastic stationary tube filled with fluid (to be confirmed). This means I can put the pump and its noisy EM emissions on the bot with the other noisy things and run a plastic tube across the tow bar, much like a trucks’ trailer air brakes. The outlet / nozzle can then be positioned just aft of the coil, marking the exact spot of detection.
And to colour the water I already have red agricultural dye on hand that is specifically formulated to mark vegetation when spraying herbicides. I’ll just need another colour - looks like Bunnings have a blue one.
Consistent dosage, no dripping, no leaking, easy no mess refill, finding space on the chockers bot and not getting any on my hands will be a challenge though.
mark
1 Like
So prior to designing the PCB I need to tidy up a few things. Firstly the leads to the coils have been shortened from nearly 2m for testing to about 50cm. As expected this reduced the parasitic capacitance greatly, evidenced by the fact that the damping resistor on the transmit coil needed to be increased from 220R to 490R. In turn this has made the coil even faster, now with a 20us pulse, I can sample as soon as 5.8us (meaning gold is now easier to detect).
Next task was to replace the bench top power supply with a Ryobi battery pack that I use for all my projects, where I can. Now you would think that the battery would be a lot more quiet than my ancient PS. It took me a frustrating day’s worth of investigation to find out that is not the case. Every 128ms I collect a digitally filtered 32 bit representation of the decaying voltage. As you can see below, in the final column, there is not much variation over time in the current measurement compared to the established baseline, less than 1mV. But every 15 seconds or so, bang, a massive variation for about half a second and then all is good again until another 15 seconds.
  10866ms  0x6a797184   4.1591558456V   diff:  -0.531mV
  10988ms  0x6a7ae6b2   4.1593780518V   diff:  -0.309mV
  11131ms  0x6a79da94   4.1592183113V   diff:  -0.469mV
  11254ms  0x6a77b9d9   4.1588935852V   diff:  -0.794mV
  11377ms  0x6a773a09   4.1588172913V   diff:  -0.870mV
  11500ms  0x6a781620   4.1589488983V   diff:  -0.739mV
  11642ms  0x6a680a63   4.1565003395V   diff:  -3.187mV
  11765ms  0x69c88efc   4.1321654320V   diff:  -27.522mV
  11888ms  0x688ad5af   4.0836844444V   diff:  -76.003mV
  12011ms  0x687c80b7   4.0814976692V   diff:  -78.190mV
  12154ms  0x69b79a6b   4.1295781136V   diff:  -30.109mV
  12276ms  0x6a64f890   4.1560320854V   diff:  -3.655mV
  12399ms  0x6a799e2b   4.1591825485V   diff:  -0.505mV
  12542ms  0x6a797779   4.1591591835V   diff:  -0.528mV
  12665ms  0x6a7891de   4.1590223312V   diff:  -0.665mV
The yellow line represents the end of the excitation pulse, the green represents the last 5V of received decay and the rising blue edge is exact sample point (acquisition time is around 300ns). With scope persistence up full you can see the ‘shadows’ in the transmit pulse and receive pulse dipping down but for a moment. More than enough to muck up any kind of accurate detection.
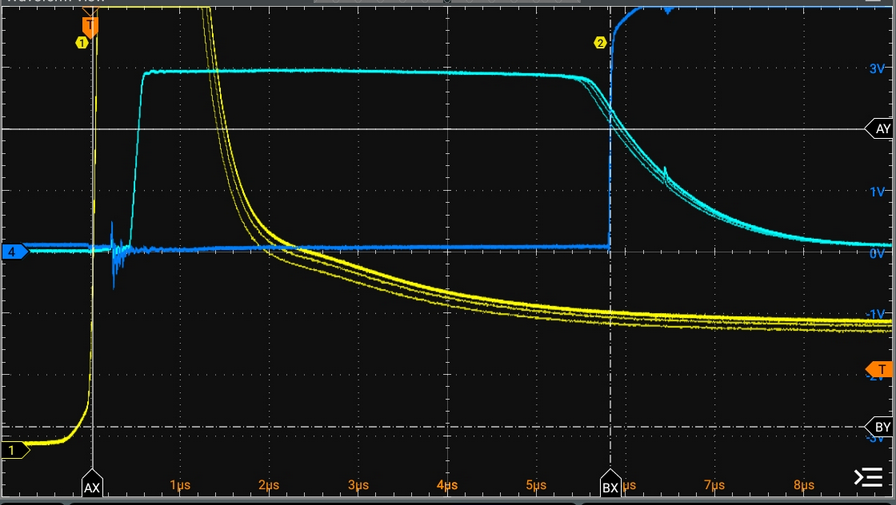
So I put the scope on my Ryobi battery pack, and even without any load, this is the unexpected response. It must be doing some kind of internal check every 15 seconds. Ahhhhh.

Zooming in on those spikes shows that the whole episode takes around 1ms and a voltage drop of about half the battery voltage!

No more Ryobi battery packs for sensitive applications.
1 Like
Battery packs sometimes turn off the output while they are checking to see whether or not a charger is connected. That’s not quite what you are seeing, but it may be related.
1 Like
Next problem to solve – drifting component parameters, especially when going to full power on the drive circuitry. This phenomenon doesn’t work well with the static baselining I have been doing up to now, but it has it’s place for pinpointing edges so I’ll keep it in the system.
What I really thought I needed was a high pass filter. I found a much better solution using statistics, in particular the standard deviation function. In the below chart, the blue line is the filtered/decimated ADC 32 bit data, decimal scale on the right axis. The green is the standard deviation, and the red is the standard deviation multiplied by the sign of the difference of the sample at the beginning and end of the sample. Bottom scale is time in ms.
From left to right, first blue run with 20us pulse, passing samples at 150mm Ag, Fe, Fe, Ag. Next run turned up pulse width to 50us which heats up the power resistors somewhat. I didn’t wait for it to stabilise so drift down is evident. Samples Ag, Ag, Fe, Fe. You’ll notice a much bigger response to ferrous metals. In the last run turned the pulse (effective power) down to 5us. Samples Ag and Ag followed by a very slow pass over samples Ag & Ag.

2 Likes
Following on from the Standard Deviation edge detector, a simple state machine has been realised to better detect a change and its direction. Now that this has been refined, it works very well up to about 20cm after which the noise kicks in – so time to reduce noise, even though I’m still on a solderless breadboard.
The plan was to un-teather the USB connection that has been used for code development but that was not as easy as it seems. In order to collect data whilst unconnected I used the RP2040 on-board flash memory, big mistake as it causes at least a 10 fold increase in the noise floor, even with another 1/2 dozen caps thrown at it. Once I figured this out I configured a single UART TX pin to output the data instead, without having to connect USB and it’s power component.
What surprised me the most, is that the noise is LESS by about 50% when power to the RP Pico is through USB – either a PC or plug pack, rather than through a on-board 7805 from the 20V supply. Nothing I have tried has managed to reduce this a – I suspect a proper PCB may help.
Another major breakthrough was a change to the pulse & sampling frequency. I was using 4kHz initially, but it is nowhere near a prime and the noise seems to contain a bit of a beat frequency. Changing this to 3719Hz reduced the noise by half.
Current baseline noise standard deviation over 10 sample in free air is
200uV USB powered, no flash
250uV Battery powered, no flash
900uV USB powered, using flash
4000uV Battery powered, using flash

Also of concern is the solderless breadboards, as posted in another thread they don’t last forever and do wear out, resulting in dodgy connections. Having said that I still have one from the 1980’s that I use occasionally - I recall it being expensive at the time. The spring steel contacts (and an unknown coating) seem a lot better designed and made and the plastic is much stronger.

2 Likes
Hi Mark
Another couple of problems with breadboards.
All those antennas you have floating around. Unfortunately there is not a lot you can do at this stage of development except be aware of the problem, particularly with high impedances such as Cmos inputs. Does not help the noise problem.
Secondly stray capacitance with these boards. With things like metal detectors being very sensitive to inductance and capacitor changes this could have quite a bearing on what you are trying to do.
Example: I recently had occasion to lash up a 7555 timer in monostable mode. Now I know the recommended minimum pulse width is in the region of 10µS but I thought I would try for 2µS. I achieved 3µS. The extra I put down to stray C. To verify I removed the timing Cap. The result a very nice 1µS pulse with the timing being done with stray C. I estimated this to be about 50pF. and I was only using about 4 or 5 square cm of breadboard.
About the same vintage as my Wish board.
Cheers Bob
2 Likes
Hi Robert,
What is a Wish board? Mine has a ‘W’ in a western style font embossed on it. Same thing?
Mark
Hi Mark
I think so. There were a lot of different boards. Mine has the word “Wish” on it and is model 502-L. I think some just had the “W”. It has proved to be very durable but I seem to remember pretty expensive at the time. Still the same. I think you can still get them. At a price.
Cheers Bob
1 Like
Roverling MkII and the Pulse Induction Metal Detector are almost ready to do some autonomous metal detecting. The trailer has been redesigned three times and a new desktop GUI provides so much more real time info at 20 samples per second over a LoRa link.

But I need some help. My previous coil housings were too flimsy and any bump, shake or flexing would result in a 20-100 mV change to my timed receive acquisitions, that are accurate to about 5nS. This is really bad when I need to detect down to 1mV changes. I’ve already managed to reduced electronic noise down to 100uV, so now it’s all physical.
In order to fix this problem, the coils you see here have been carefully epoxied (lots of) onto a 6.4 mm glass plate. The transmit coil is made of 10 turns of 24 AWG enameled magnet wire, whilst the receive coil is 50 turns of 30AWG Teflon insulated silver plated copper, AKA wire wrap wire. The receive coil has a Faraday shield made from conductive aluminium tape, but will be changed to copper in the next iteration. The trailer itself is made from PVC sheeting, and forms a bash plate that the glass sits on top of.
This system works really well now, with bumps and knocks no longer impacting the samples enough to cause a problem. However the new big problem is weight. The trailer is 6.8 kg without the battery, which has now been relocated to the front of Roverling for better weight distribution and to improve traction (front wheel drive).
But this setup is way too heavy. Roverling run time is reduced substantially and traction is a real problem, especially with the terrain around here. I know I could go back to the drawing board with Roverling, but I don’t want to go down that path.
What I really need is something that is very rigid, about 600x400mm, nonmetallic, light and not too costly, but I can’t think of anything suitable. I’ve been stumped for a while, so if anyone has got any ideas, I’d really like to know.
Thanks, Mark
PS. I’ll be offline until the New Year, so if you reply before then, I’m not ignoring you
PSS. Wishing everyone a great festive season ![]()
![]()
![]()
2 Likes
Hi Mark
The “very rigid” in that size is the hard part. You could think polycarbonate but by the time you met the “rigid” criteria it would probably be pretty heavy.
Unless you can get some thinner material and stiffen it up with some angle extrusions or box section material.
Cheers Bob
2 Likes
Hi Mark,
A cheap suggestion would be your geometries, if you add some spars along the top and bottom you could likely do away with the glass (it looks like this is the densest material).
If you can bind the two coils together and remove them from the glass, and replace that with some PC that will yield large weight savings.
(to put my thoughts into a photo, something like this : https://www.bunnings.com.au/all-set-100l-grey-and-green-heavy-duty-storage-container-with-flat-lid_p0406871)
1 Like
Thanks for the suggestion @Liam120347. I have some of those at home, I get the idea, but these are very flexible.
Hey Bob,
I’ve taken a plunge, and for the first time collaborated with an AI system to come up with a suitable design, taking into account weight, rigidity, fabrication and cost. In my next iteration I will be trying 10mm perspex, with grooves routed on both sides to house the coils and material removed where it is not needed whilst maintaining rigidity. Grooves will then be filled with epoxy.
1 Like
Hi Mark
Sounds like a solution.
You should make sure the whole thing works as expected before you go mad with any epoxy. That stuff can be pretty final.
Cheers Bob
2 Likes